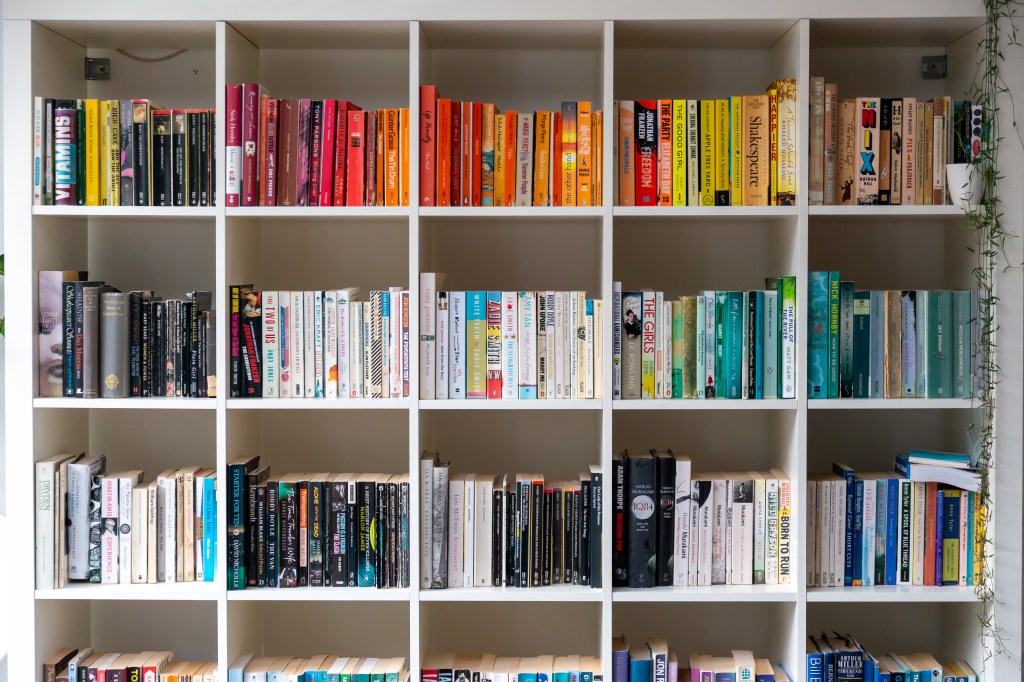
Books to me are more than stories bound in pages. They’re adventures, companions, and a way to explore the vastness of my imagination. I’ve been an avid reader for a few years now and was curious about the state of my personal library. After being inspired but Giorgia Lupi and Stefanie Posavec‘s Dear Data project, I took a dive into my bookshelves to create a data portrait of my books. What came out of it was a hand drawn visualization that is a color, symbolic, and comprehensive look at my library.
What Was I Looking For?
With this visualization, I wanted to answer four questions. I wanted to know what genres of books I owned – fiction or nonfiction as well as sub genre like romance, fantasy, self-help, etc. I also wanted to know the format of books I own. I don’t stick with one format. I own books in physical form, digital, and audio. The other question I wanted to know was if I have finished the book, left it unfinished, or haven’t read it at all. The last piece I was curious about was whether or not I liked the book if I have read it.
The Key
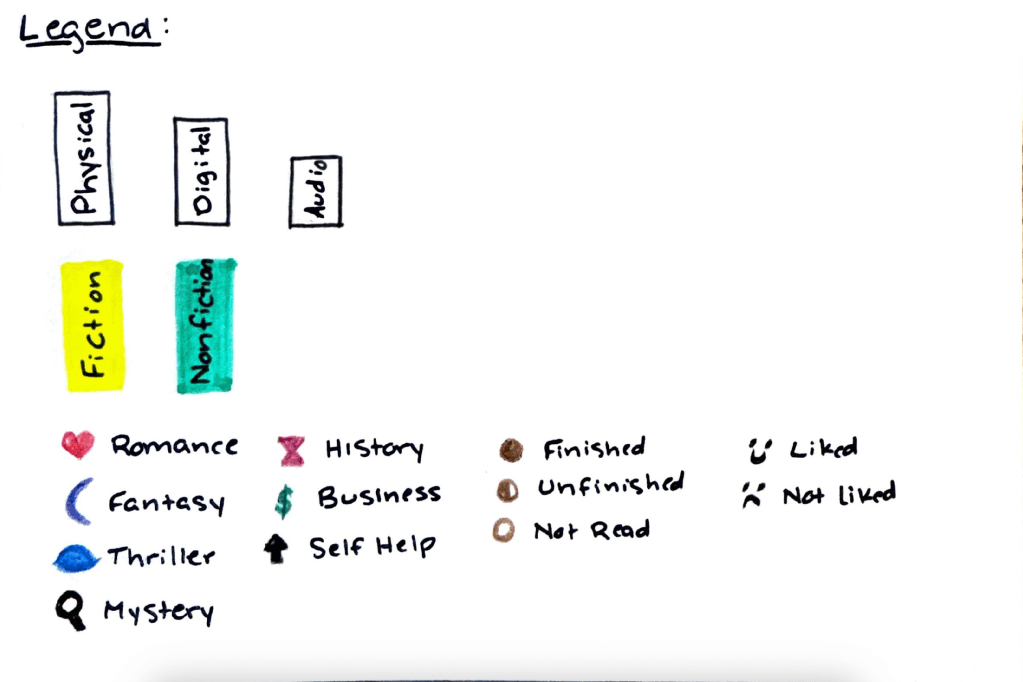
I didn’t want this visualization to be a plain chart. I wanted it to capture my collection through carefully selected visual codes. I drew this visualization to look like books lined up on a shelf. I own books in three different formats; physical, digital (on my Kindle), and audiobooks. This is represented through the size of each book. Physical books are the tallest, audiobooks are the smallest, and digital books are in between. The color of the book depicts whether it’s a fiction or nonfiction book. Fiction is yellow and nonfiction is a teal green color. This colors are distinct from each other so the difference is easy to spot. On the spines of each book, I denoted the sub genre with a small symbol that represents the genre. I also denoted if I have read it or not with a filled in circle, half filled circle, or open circle. To show if I liked it or not, I marked the spine with a smiling or frowning face.
The Visualization and Findings
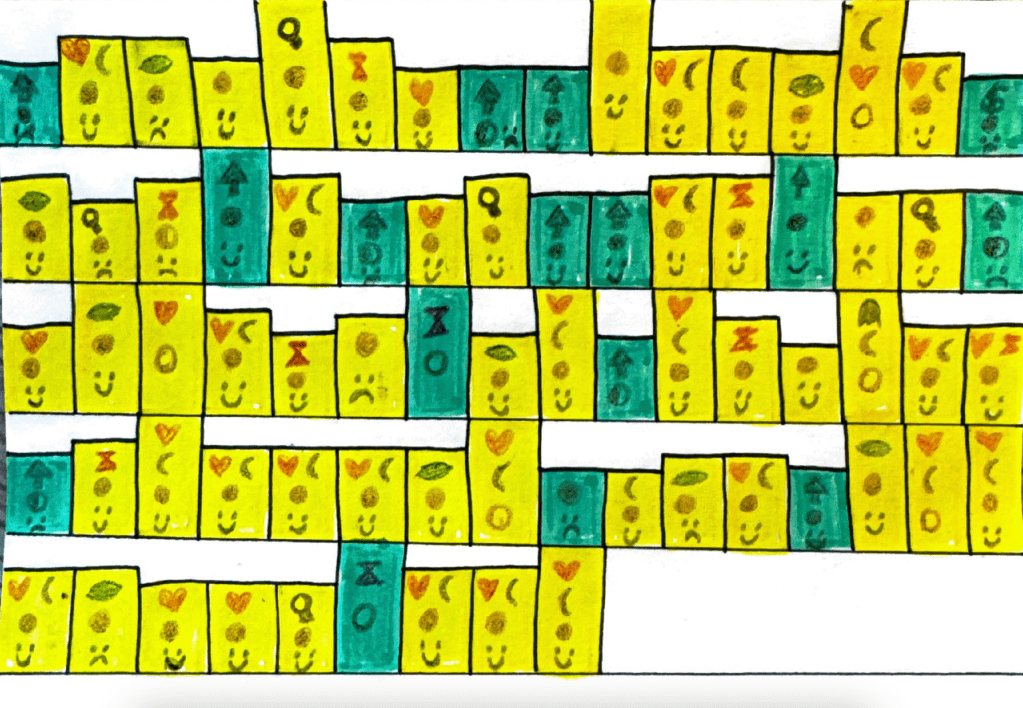
I created a data-driven-exploratory visual to represent the books in my collection. The goal of my drawing was to draw multiple conclusions and explore the relationships and patterns of the books. From the drawing, I was able to see many different patterns that I both was aware of and was not. First, I knew that I preferred fiction books over nonfiction and it’s clear to see the number of yellow books is much higher than the number of teal green books. I also knew that I owned the least amount of physical books (18) and the most in digital (28). It’s also clear to see that I have finished most of the books in my library and have liked them. There were a few patterns that I drew from my drawing that I wasn’t aware of. I noticed that the self-help books I have are audiobooks and I usually don’t like them. That might be because I’m not a fan of self-help or it could be because I don’t like the format. I also noticed that I own a lot of books that have romance as part of the genre. Either it’s a regular romance novel or it’s a historical romance for romantic fantasy. I never considered myself to be a romance reader, but I notice that there was many red hearts on the spines. I found all of these conclusions to be very fascinating and I was excited to learn the patterns in my reading.
Rediscovering Through Visualization
After creating this visualization, I didn’t just catalog my books. I rediscovered why I love reading. I found it so interesting to see all of my books representing in one place. In life, they’re all over the place; on my shelves, on my phone, and in my Kindle. As I drew each book, I got the opportunity to revisit each story and remember something about that book. It also showed me what I like and don’t like. Now when I want to go shopping for books, I know what I’ll be drawn to and what I most likely won’t like.


Leave a comment