
For my second Dear Data project, I wanted to focus on something that I do everyday but, don’t often pause to think about and that’s getting dressed. Each morning is the same routine – a rushed scan through my closet to find something that fits exactly how I’m feeling, where I’m going, and what the weather is. This week, I tracked not only what I wore, but how I made my outfit choices.
What I Tracked and Why
Before I started tracking, I thought about what patterns I was looking to learn from tracking. For instance, I was aware that I wear a lot of black in general, but I wanted to see just how much of my wardrobe was black. As I thought more about my usual clothing choices, I landed on five questions to ask myself at the end of each day:
- What types of clothing items do I wear?
- What colors and materials are most common?
- Do I often repeat items or entire outfits?
- What was the weather like on each day?
- How much time did I spend deciding what to wear?
These questions were simple, but revealed a lot of insights.
Building the Visual
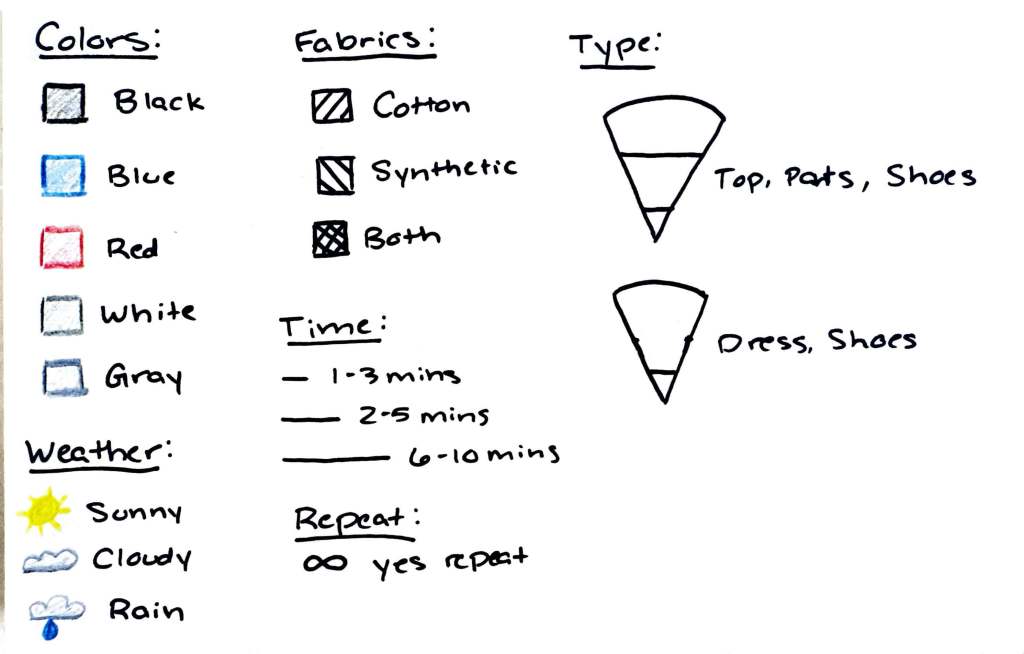
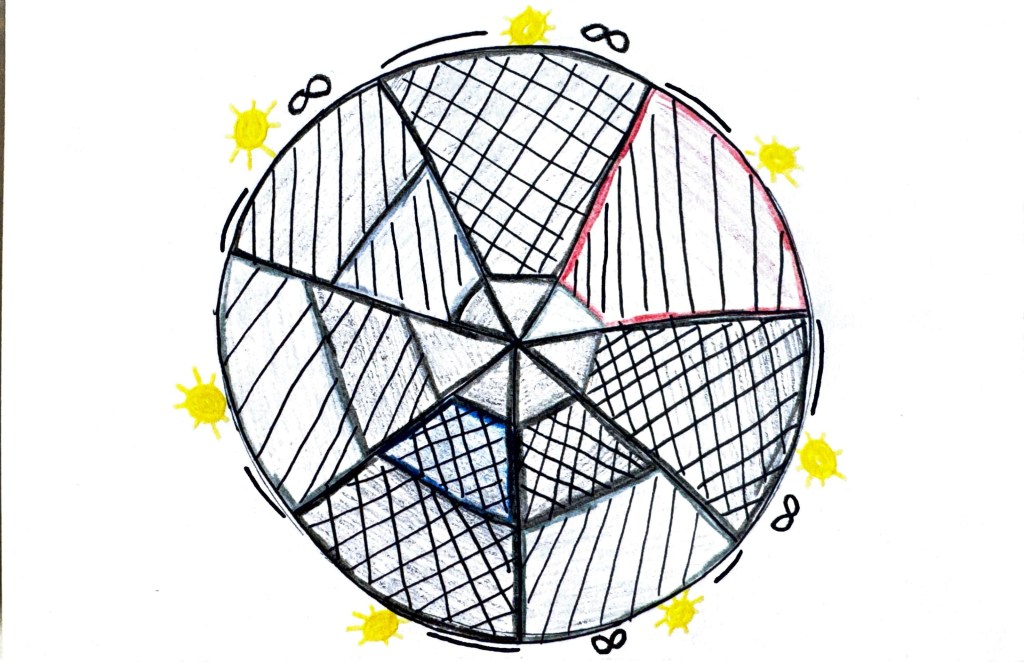
My visual was a pie chart with each of the seven segments representing one outfit over the seven day period. Within each segment I used different colors, patterns, and symbols to represent the outfits:
- Color (outlined and shaded in either blue, white, gray, red, or black)
- Fabric (cotton, synthetic, or a blend using directional lines and cross hatching)
- Clothing type (each slice is divided into three segments for top/pants/shoes or two segments for dress/shoes combinations)
- Weather (a sun, cloud, or rain cloud symbol above each each segment)
- Decision time (a specific length of a line above the segment)
- Repetition (an infinity symbol to represent repetition)
What I Learned
After seeing the completed visual, these were my main takeaways:
- I default to neutral colors like gray, white, and black: Going into this experiment, I knew that I wore a lot of neutrals, but I found it interesting how much of those colors I wore. All but one day included at least one of those colors.
- I repeat more that I thought: I noticed that I often gravitated toward the same combinations of outfits with a slight variety in color. Throughout the week, the item I noticed I repeating the most was shoes.
- The weather affects decision speed: Everyday of the week was sunny and everyday it took me five minutes or less to get dressed. I think this is because I didn’t have to spend thinking about what pieces would protect me from the rain or keep me warm.
- I wear a lot of cotton: Throughout the week, I tended to stick with cotton or cotton blend items. I would attribute this the summer season and wanting to stay cool and comfortable.
- Dresses are rare: This is probably the finding that shocked me the most. I like to wear dressed because they’re easy to throw on and don’t take a lot of time to decide on. However, this week I stuck to more tops and pants combinations that dresses.
Looking Forward
This exercise made me rethink what it means to make a decision. I’ve always liked getting dressed and fashion, but after seeing the data from the week I realized I make a lot of my clothing decisions based on what’s functional and quick. I’ve recently been thinking about my personal style and brand so this exercise came at the right time. Now I feel more aware of what I like and feel comfortable in so maybe I can try to avoid those dreaded moments standing in front of my closet thinking, “How come I have nothing to wear?”


Leave a comment