-
 Continue reading →: Emotional Design, the Experience Economy, and the Ethics of Feeling
Visual storytelling doesn’t operate through just images and narrative, but also though emotion. Every room we walk into, interface we interact with, and product we buy and use has the potential to change how we feel before we even know it. This realization led me to explore the relationship between…
-
 Continue reading →: The Rituals of Reading
In the quiet moments of the day, reading becomes an easy ritual. Starting off slow mornings by the soft glow of a lamp to afternoons among the shelves of a bookstore. Books move through these moments like easy friends, creating a rhythm that eases the mind. This photo essay traces…
-
 Continue reading →: Designing for the Mind: How Behavioral Economics Shapes What We See, Feel, and Do
We make thousands of visual decisions everyday; decisions like what the read, what to buy, and even what to trust. A lot of the time, these choices feel instinctive and almost automatic. However, in reality, they are shaped by the invisible relationship between behavioral economics and design. Designers know that…
-
 Continue reading →: Designing Feelings: How Emotions Turns Products into Experiences
In today’s marketplace, products and services are no longer just enough. Joseph Pine and James Gilmore explained in Welcome to the Experience Ecomony that businesses must stage experiences that engage customers emotionally. For example, a cup of black coffee only costs a few sense to make, but when combined with…
-
 Continue reading →: How Visual Storytelling Imagines Tomorrow
Ellen Lupton reminds us in her book, Design is Storytelling, that “design is the art of thinking ahead and predicting possible futures”. Her ideas about scenario planning and design fiction show how design can move beyond solving problems and can visualize what might come next. These tools connect directly to…
-
 Continue reading →: Madness Made Visible: Women, Detail, and the Art of Descent
Taylor Swift’s song The Fate of Ophelia, the first song and single, off of her newest album, The Life of a Showgirl, paints a picture of a woman saved from descending into madness by new love. The song can be related to how her relationship with Travis Kelce saved her…
-
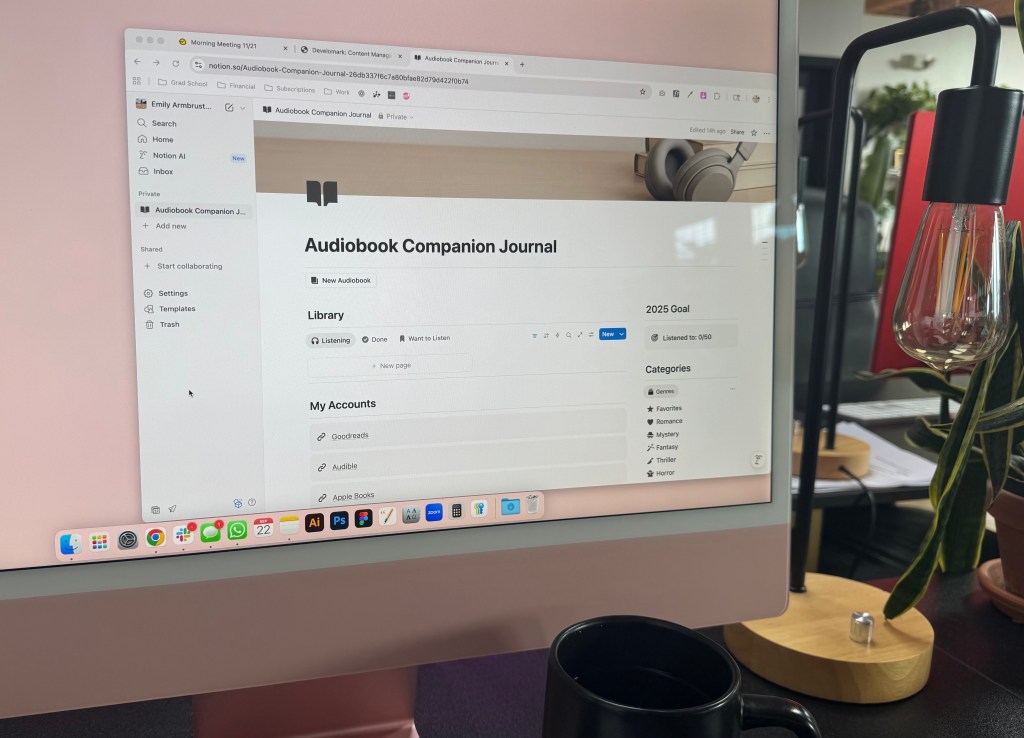
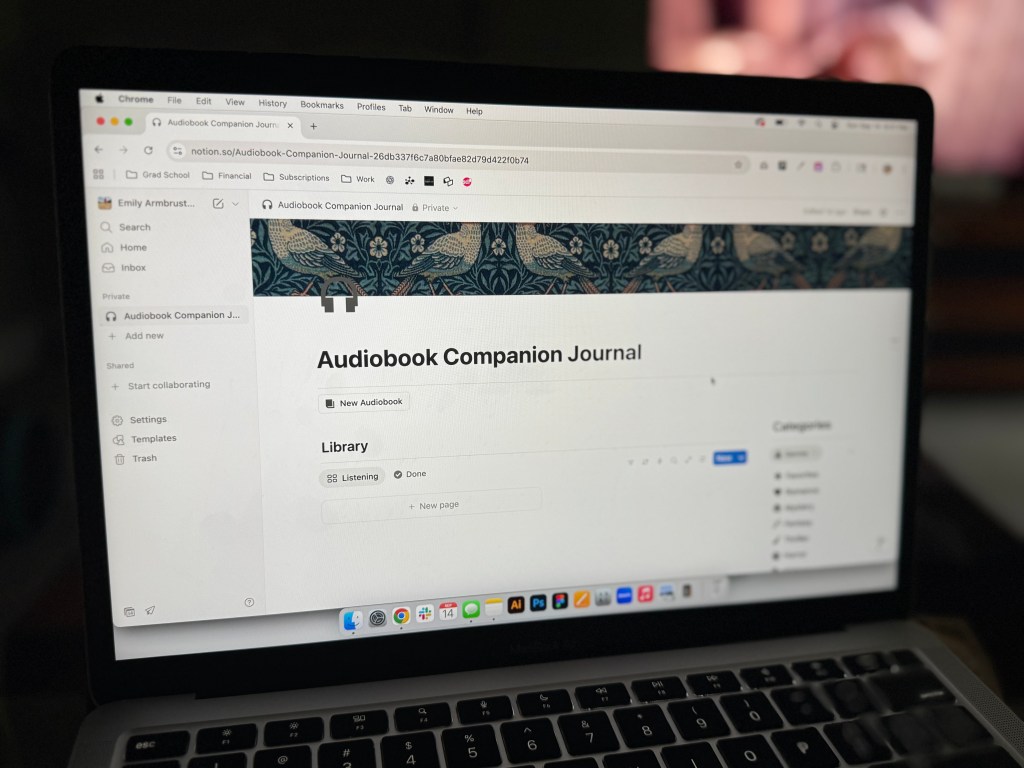
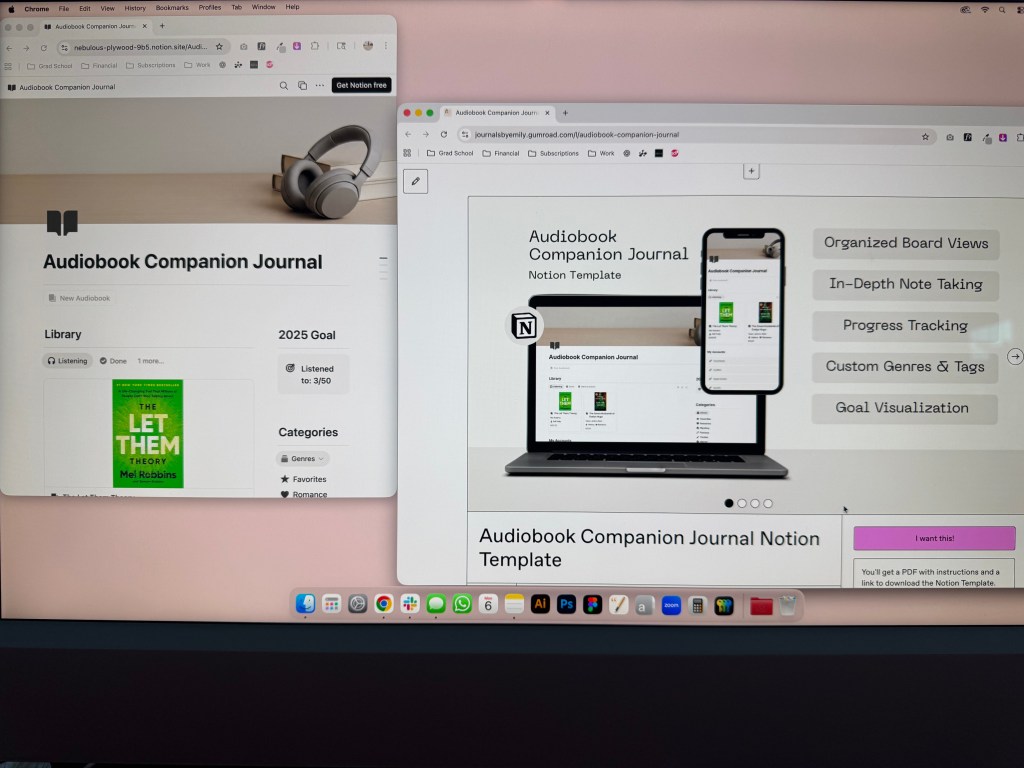 Continue reading →: Introducing the Audiobook Companion Journal: Listen Smarter and Remember More
After weeks of building, I’m happy to announce that my audiobook companion journal Notion template is finally available for purchase. If you love audiobooks, but often find yourself forgetting the key takeaways and important moments as soon as you’re done, this is the product for you. Between long commutes, multitasking,…
-
 Continue reading →: Product is Complete – Now it’s Time to Go to Market
This week marked a big milestone in my journey to build a digital product – my audiobook companion journal is now officially complete and ready to launch. After three weeks of building and testing, I spent the past few days putting on the finishing touches and ensuring that the experience…
-
 Continue reading →: The Middle Mile: Pushing Through Development
When building or creating anything, there always comes a point when the excitement of starting fades away and the reality of the work sets in. This past week was one of those weeks for me as I continued to develop my Notion template. I made solid progress, but also faced…
-
 Continue reading →: Audiobook Companion Journal: Week 1 Build Progress
This week I started a very exciting (and slightly overwhelming) step in my digital product journey. I officially started building my audiobook companion journal in Notion. It has definitely been a learning curve, but I’m starting to see the vision take shape and that’s so exciting and motivating to me.…
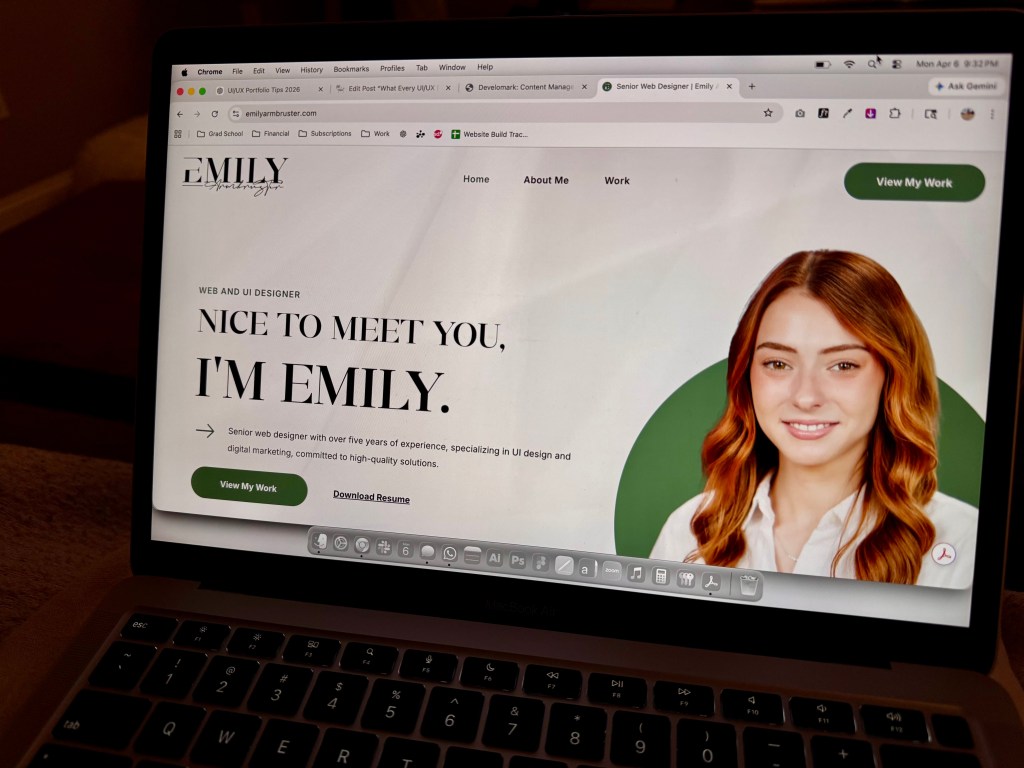
Hello,
I’m Emily

Emily is a skilled website designer at Develomark, dedicated to creating websites that perfectly align with your brand. With a keen eye on the latest design trends, she ensures every site reflects exactly what you envision.